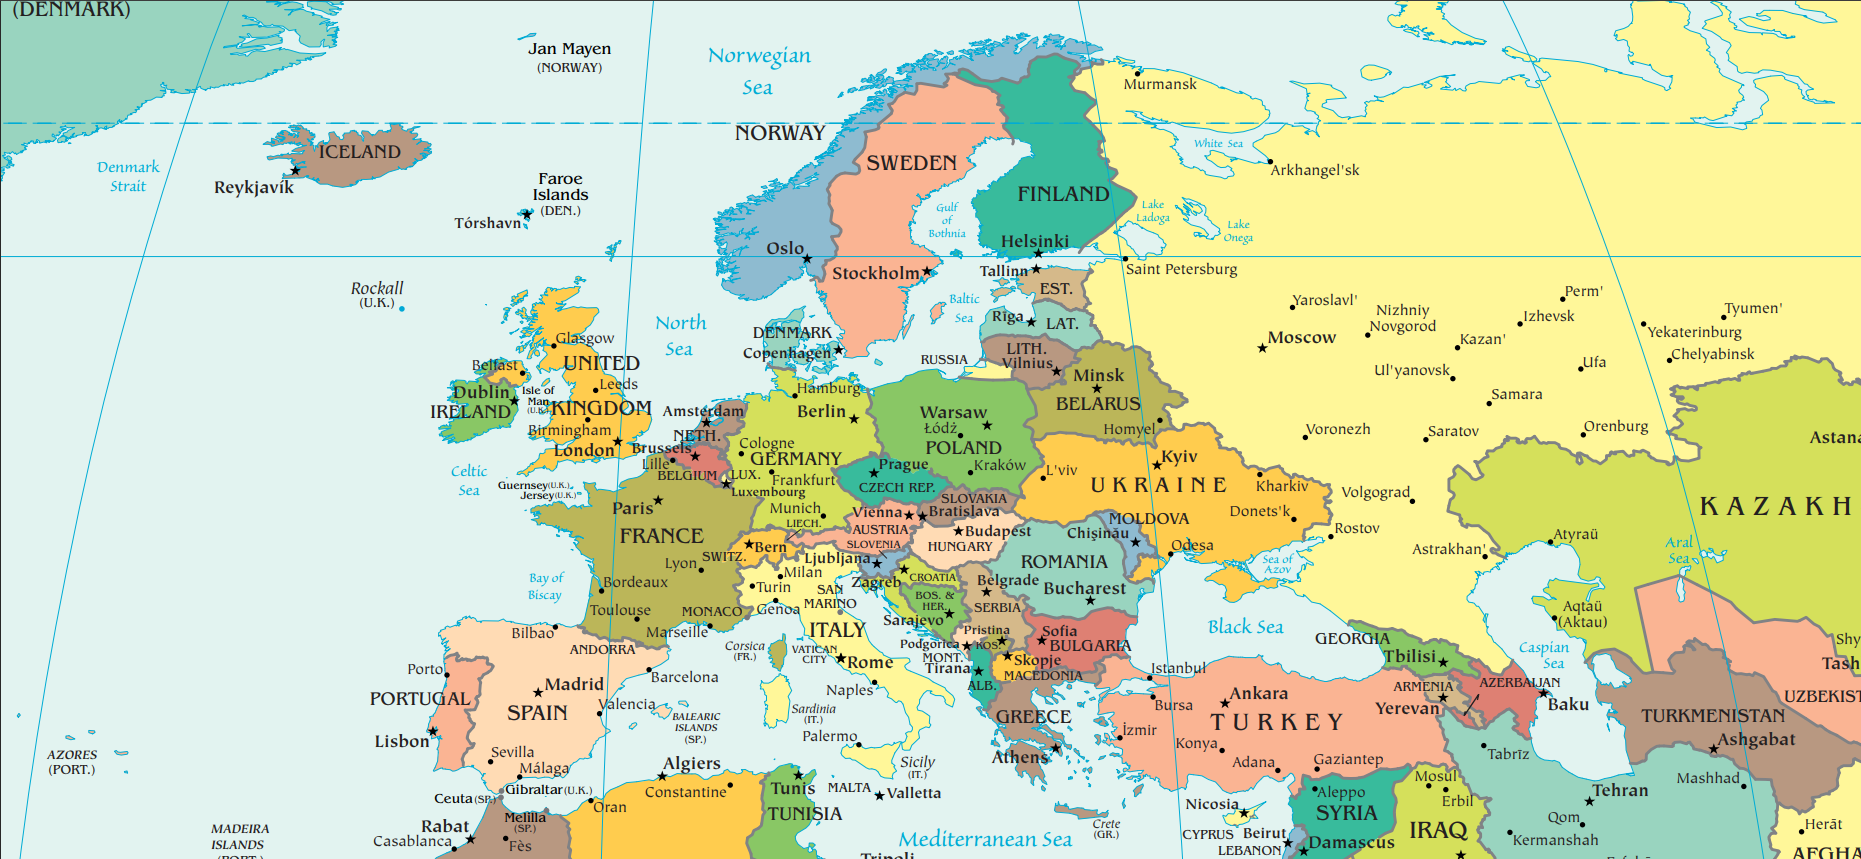
How does Georgia’s labour market compare with its neighbours? Eurostat’s statistics for the EU’s Eastern Neighbourhood show that in 2021 Georgia had the highest unemployment rate and the highest youth unemployment in the group, alongside the largest fall in employment rates over the previous decade. More recent IMF and ILO analyses reach similar conclusions on youth inactivity and informality. This analysis brings those comparisons together, with their caveats. (An earlier version of this page attributed a recent assessment to the OECD that GILS could not locate; it has been replaced with these sources.)
Key Findings
- In 2021, Georgia’s unemployment rate (20.6%) was the highest among the ENP-East countries, compared with 15.5% in Armenia, 9.8% in Ukraine, 6.0% in Azerbaijan, 3.2% in Moldova and 7.0% in the EU (Eurostat, 2024).
- Georgia recorded the highest youth unemployment: 44.3% for young men and 40.5% for young women in 2021 (Eurostat, 2024).
- Employment rates for ages 20–64 fell in Georgia by 12.2 points for men and 12.6 for women between 2011 and 2021 — by far the largest falls in the group, partly reflecting a 2020 methodology change (Eurostat, 2024).
- Georgia had the largest services share of employment in the group (62.1%) but still below the EU (71.4%) (Eurostat, 2024).
- The IMF (2026) finds Georgia’s unemployment above most peers and youth inactivity notably high; the ILO (2026) finds informality higher than expected for Georgia’s income level.
1. Introduction
As an EU candidate, Georgia is increasingly compared with its Eastern Partnership neighbours and with the EU. Comparisons are useful but must be handled carefully: Eurostat notes that some ENP-East countries compile labour force data using definitions that differ from EU standards, and that comparisons over time within countries are often more reliable than comparisons between them (Eurostat, 2024). Georgia’s 2020 methodological change — excluding subsistence farmers from employment — creates a break in its series.
2. Findings
2.1 Unemployment
Georgia’s unemployment fell each year from 2011 to a low of 11.6% in 2019, rose to 18.5% in 2020 and 20.6% in 2021, reflecting both the pandemic and the series break (Eurostat, 2024). Geostat data show it has since fallen to 13.9% in 2024 and 2025.
2.2 Employment and the gender gap
| Country | Unemployment (15–74) | Youth unemployment, men / women (15–24) | Self-employed & family workers (% of employment) |
|---|---|---|---|
| Georgia | 20.6% | 44.3% / 40.5% | 31.8% |
| Armenia | 15.5% | 28.0% / 33.6% | 33.2% |
| Azerbaijan | 6.0% | 12.3% / 16.5% | 65.8% |
| Moldova | 3.2% | 9.0% / 9.6% | 21.8% |
| Ukraine | 9.8% | 18.0% / 20.3% | 16.5% |
| EU | 7.0% | 16.5% / 16.7% | 12.0% |
Source: Eurostat (2024), European Neighbourhood Policy – East labour market statistics. Data extracted January 2023.
2.3 More recent comparisons
The IMF’s 2026 Selected Issues paper, comparing Georgia with Europe and Central Asia peers, finds that unemployment has fallen to a historic low but remains above most peers, especially among young people; that labour force participation is broadly in line with peers; that youth inactivity is notably high; and that wages lag peers (IMF, 2026). The ILO’s 2026 working paper finds informality in Georgia higher than expected given its income level (Pignatti, 2026).
3. Discussion
What the comparisons show
Across sources and years, the same pattern appears: Georgia’s challenge is less about participation in general than about converting participation into employment, especially for young people. Georgia’s distinctive features are high unemployment, very high youth unemployment and informality above what its income would predict.
Caveats
Very low unemployment in some neighbours reflects definitions, large agricultural and self-employed sectors (as in Azerbaijan) or emigration, not necessarily stronger labour markets. Georgia’s 2020 change in methodology means that its rise in unemployment and fall in employment between 2011 and 2021 partly reflect statistical reclassification.
4. Conclusion
Regional comparisons consistently place Georgia among the weakest performers on unemployment and youth outcomes, even after recent improvements. As an EU candidate, Georgia’s relevant benchmark is increasingly the EU itself, where employment rates in 2021 were about 20 points higher for men and 24 points higher for women.
GILS Recommendations
- Align Georgian labour statistics fully with EU LFS definitions and publish harmonised series for regional comparison.
- Set national targets for youth unemployment and the employment rate, benchmarked against EU candidate peers.
- Prioritise youth transition and formalisation, the two areas where Georgia lags most.
GILS Position
Comparisons should inform policy, not rank countries. They show clearly where Georgia must improve: jobs for young people and formal employment.
References
- Eurostat (2024). European Neighbourhood Policy – East – labour market statistics. Statistics Explained. ec.europa.eu
- IMF (2026). Georgia: Selected Issues. Country Report No. 26/134. imf.org
- Pignatti, C. (2026). Recent Trends on Informal Employment in Georgia. ILO Working Paper 159. ilo.org
- GBC (2026). The unemployment rate in 2025 has not changed — 13.9%. gbc.ge
Suggested citation: GILS Research Team (2026). Georgia’s Labour Market in Regional Comparison. Editor: G. Pkhakadze. Georgian Institute of Labour Studies, Tbilisi. labour.edu.ge
GILS analyses are prepared with AI-assisted drafting. All figures and claims are verified against the cited primary sources and reviewed under the responsibility of the Editor.